
Frequency Chart
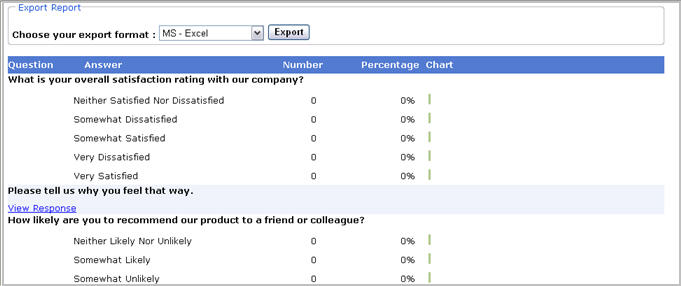
In Frequency chart, your report will displayall the question and answers in the feedback form.

It also displays the number of respondents who have chosen uniform answers for a particular question and the ratio is also displayed in the percentage column.
All open ended comments can be viewed by clicking on 

You can choose to export your reports either in Excel or to PDF format.